Exploratory Data Analysis
I began with many horse racing datasets obtained from various sources. Specifically, the data included race
information (track, distance, class, etc.) and horse information (everything about the horse including its age, sex, win strike rate
and details of its past performances).
Data must always be reliable and of a high quality, otherwise it will almost always contribute to wrong outcomes or predictions.
This is why I spent much time gathering as much data as I could on all different aspects of horse racing. I then cleaned the data to remove
unwanted data, missing values, duplicate values, etc.
After cleaning the data, the challenge was to understand what variables would be informative and worthy of including in my model.
To that end, I performed an exploratory data analysis.
Findings
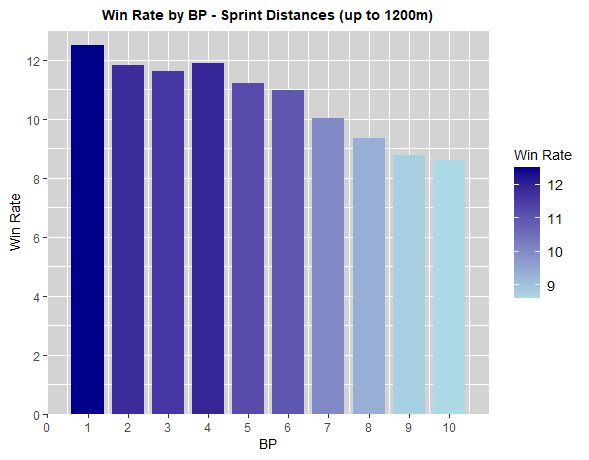
Firstly, there is a strong correlation between the horse’s barrier position and its win rate, specifically over sprint distances
(usually up to 1200m). Specifically, win rates are the highest starting from barrier position 1. Inside barrier positions perform the best,
then as the barrier position gets wider, wins begin to drop off.
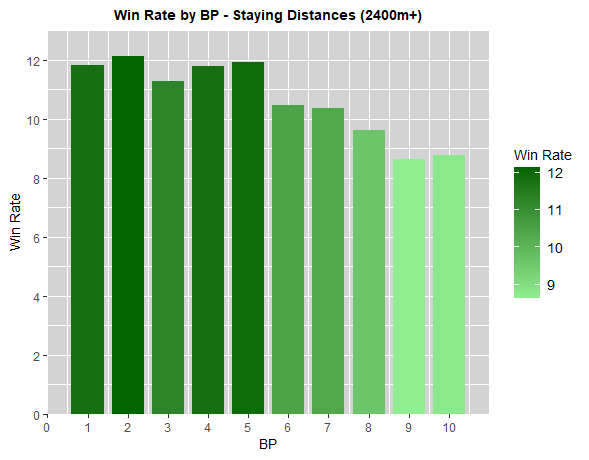
However, when exploring a horse’s win rate by barrier position over staying distances (typically greater than 2400m), there does
not appear to be a strong correlation between the horse’s barrier position and its win rate.


