DASHBOARD REPORTING

I have prepared and created Dashboards in Excel for several clients. My dashboards provide data insights to the client in real-time. All dashboards have the ability to track KPIs and key metrics and allow you to make the right decisions using accurate and effective data. They are customisable and adjustable with a few clicks, giving you the ability to create and share custom views of your data.

All information shown in the following dashboards is fictitious and is for demonstration purposes only.
BUSINESS DEVELOPMENT DASHBOARD

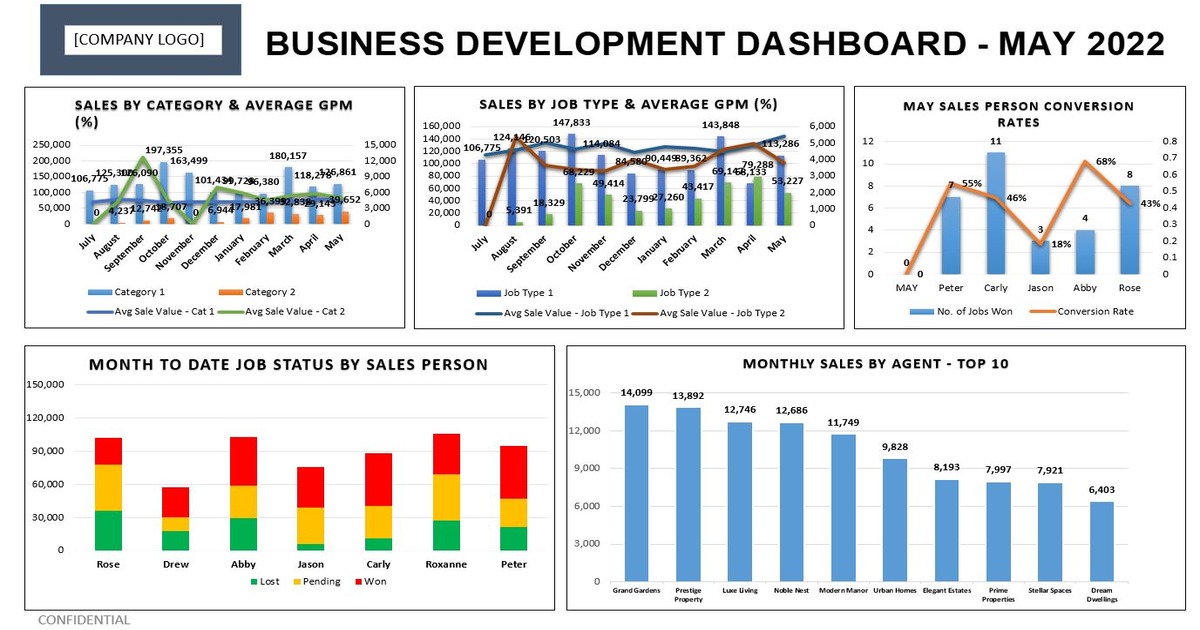
This dashboard is one that I created for a client that focuses on sales. It gives the client a snapshot of sales across a number of important KPI’s. The dashboard is fully automated, and allows the client to navigate through it by selecting any time period from the past. This provides the client with a quick and easy way to compare current data with previous data and to identify patters or relevant trends.


FINANCE DASHBOARD

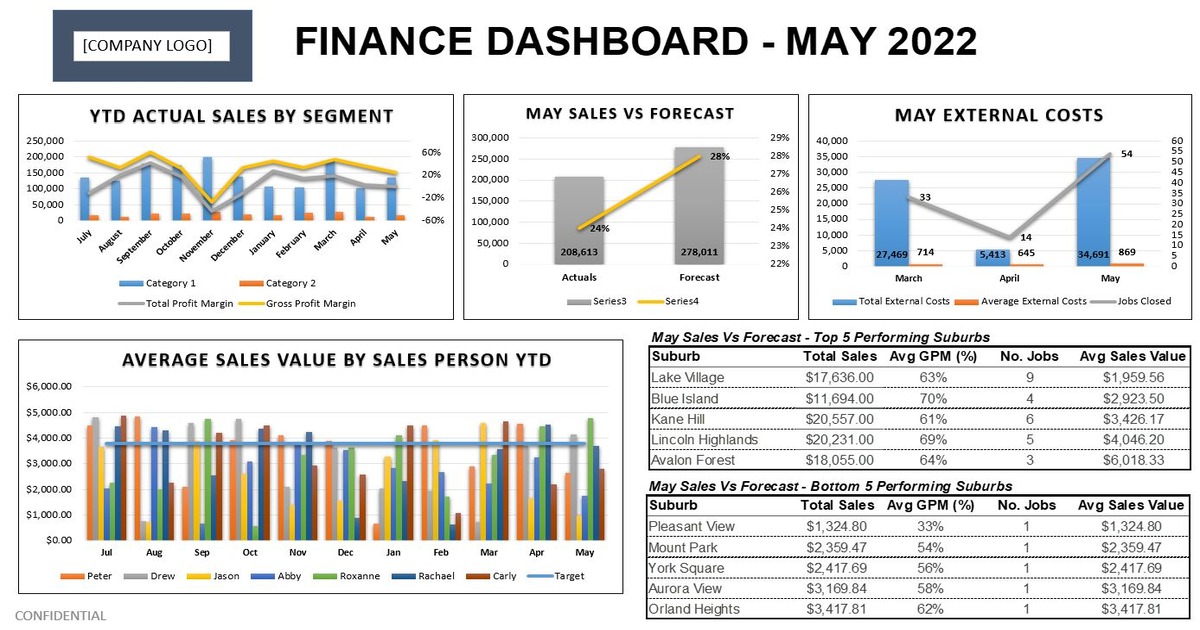
This dashboard looks at Financials, and focuses on visualization of key data. The client is able to gain valuable insights into important financial metrics and trends, all at the click of a button. The dashboard has a simple interface with several charts. All relevant indicators are shown on one page, giving the client a complete overview of vital information that they need to know.


EVENTS DASHBOARD

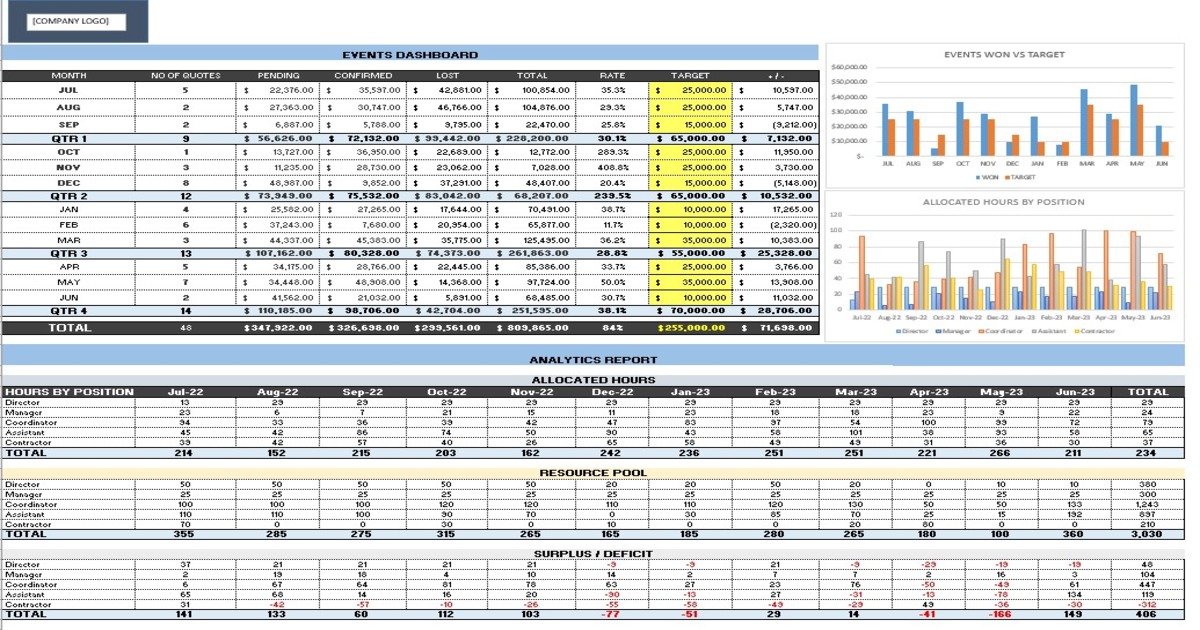
Another example of a dashboard is shown here that I compiled for an Events company. It provides the client with a snapshot of all relevant key metrics, including quotes won or lost, conversion rates, and performance against targets. The bottom half of the dashboard provides tracking and forecasting on staff hours by position, and how these compare with current resourcing. This allows the client to accurately plan and forecast staffing numbers for various events in upcoming months.